
Start Spectrum Analyzer
Click to activate the microphone and see the full frequency spectrum
See the Full Frequency Picture
Every sound contains a rich mixture of frequencies. The spectrum analyzer reveals them all—from fundamental tones to harmonic overtones—helping you understand timbre, diagnose resonances, and explore the acoustic fingerprint of any instrument or voice.
In the app
Here are some things that are even better in the app.
-
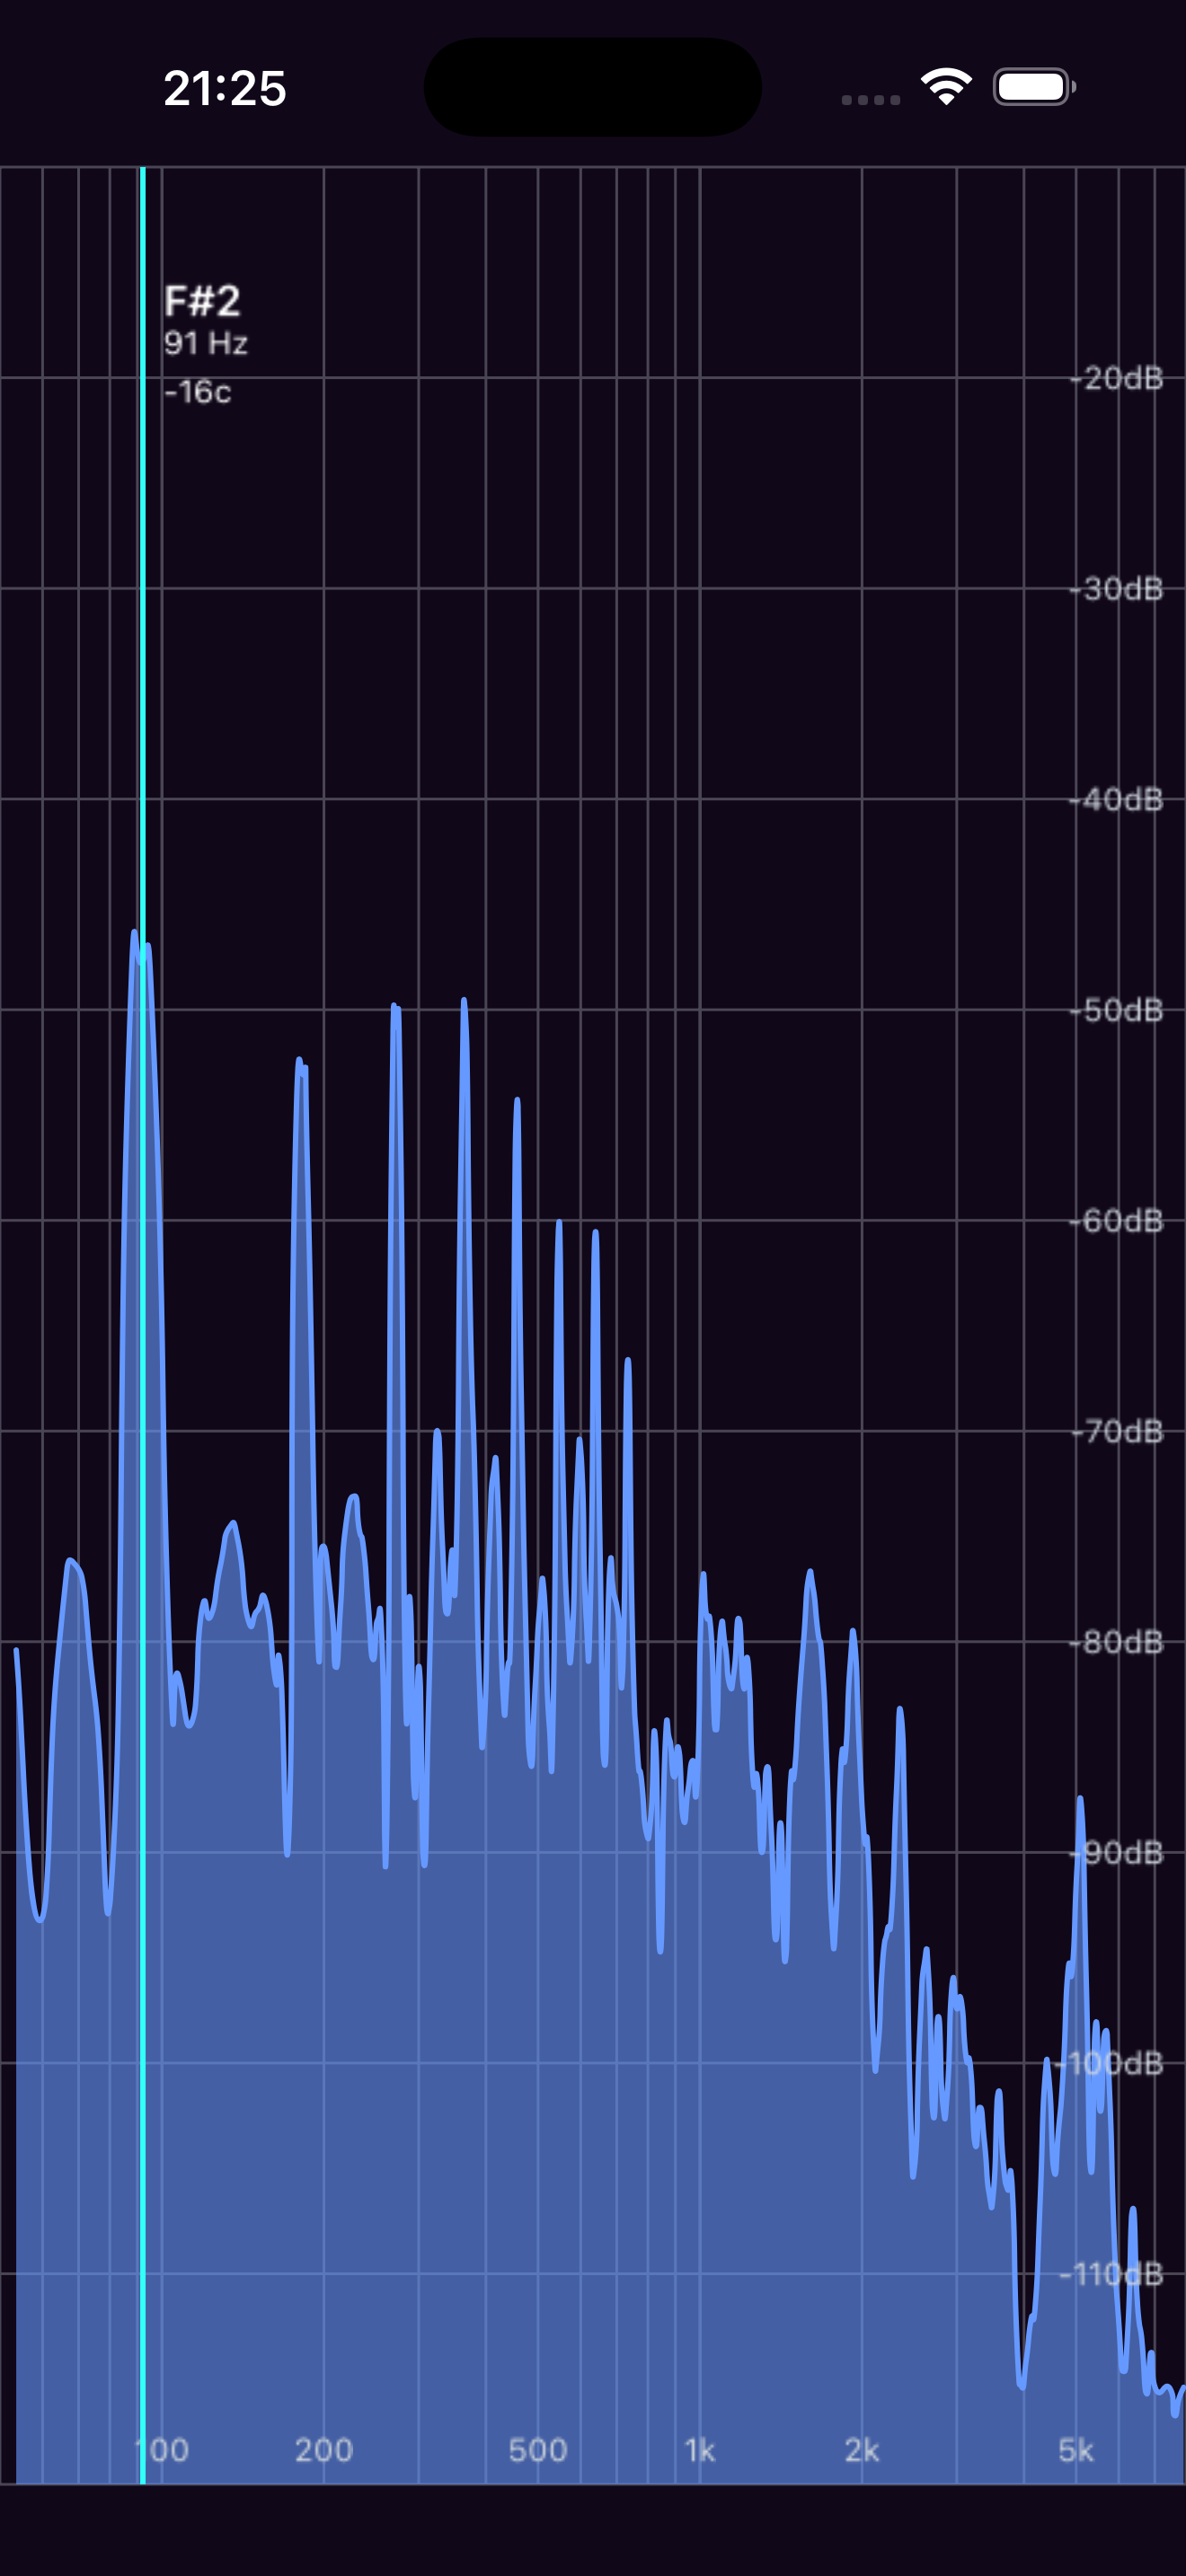
Named peaks
Stable partials labeled with note, frequency, and cents.
-
Higher sensitivity
Faster response and higher resolution.
-
Better form factor
Improved portability, performance, and diagram quality.
The Full Experience

What the spectrum reveals
Pitch tells you which note. The spectrum tells you everything else about the sound: the overtones, the room, and the frequencies you did not mean to make.
Tilted so music looks like music
Raw spectra sag toward the top end until the high octaves look empty. A 3 dB per octave tilt puts brightness back where your ear expects it.
Close partials stay apart
A large transform separates overtones only a few hertz apart, and averaging across frames holds the trace steady enough to read.
Rumble and air on one screen
10 Hz to 20 kHz on a logarithmic sweep, so every octave gets equal width instead of everything crowding to the left.
10 Tools for Musicians
The mobile app groups them the same way: analyze what you play, make sound, then train your ear.
Analyze
Pitch Diagram
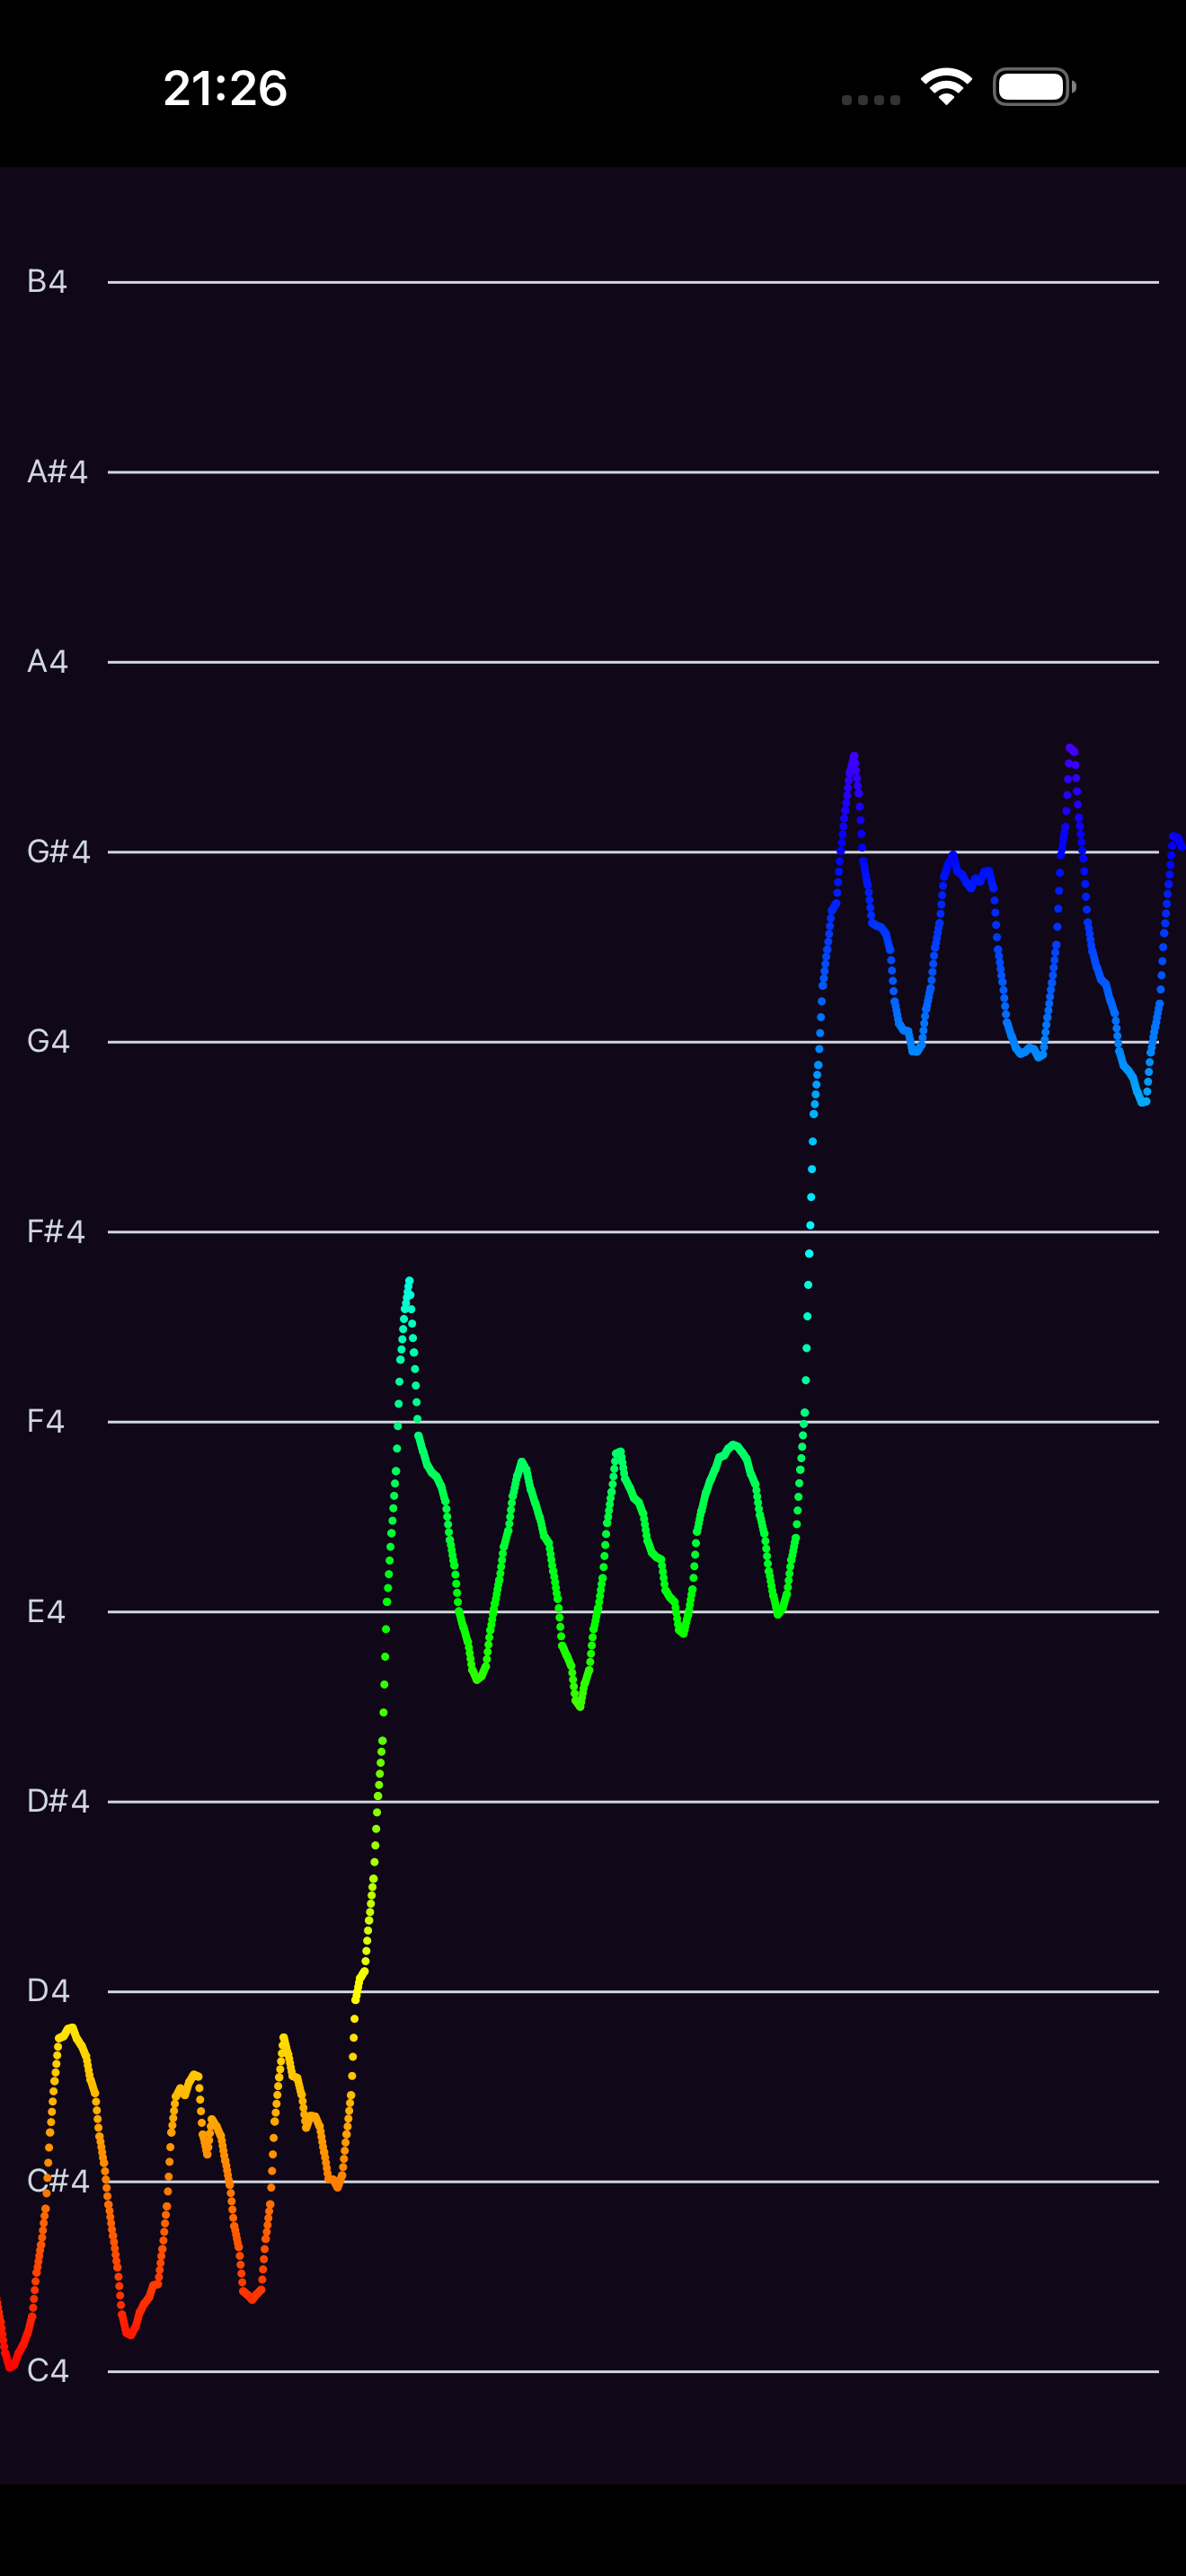
Real-time pitch graph. See every note you sing or play.
Pitch Spectrogram
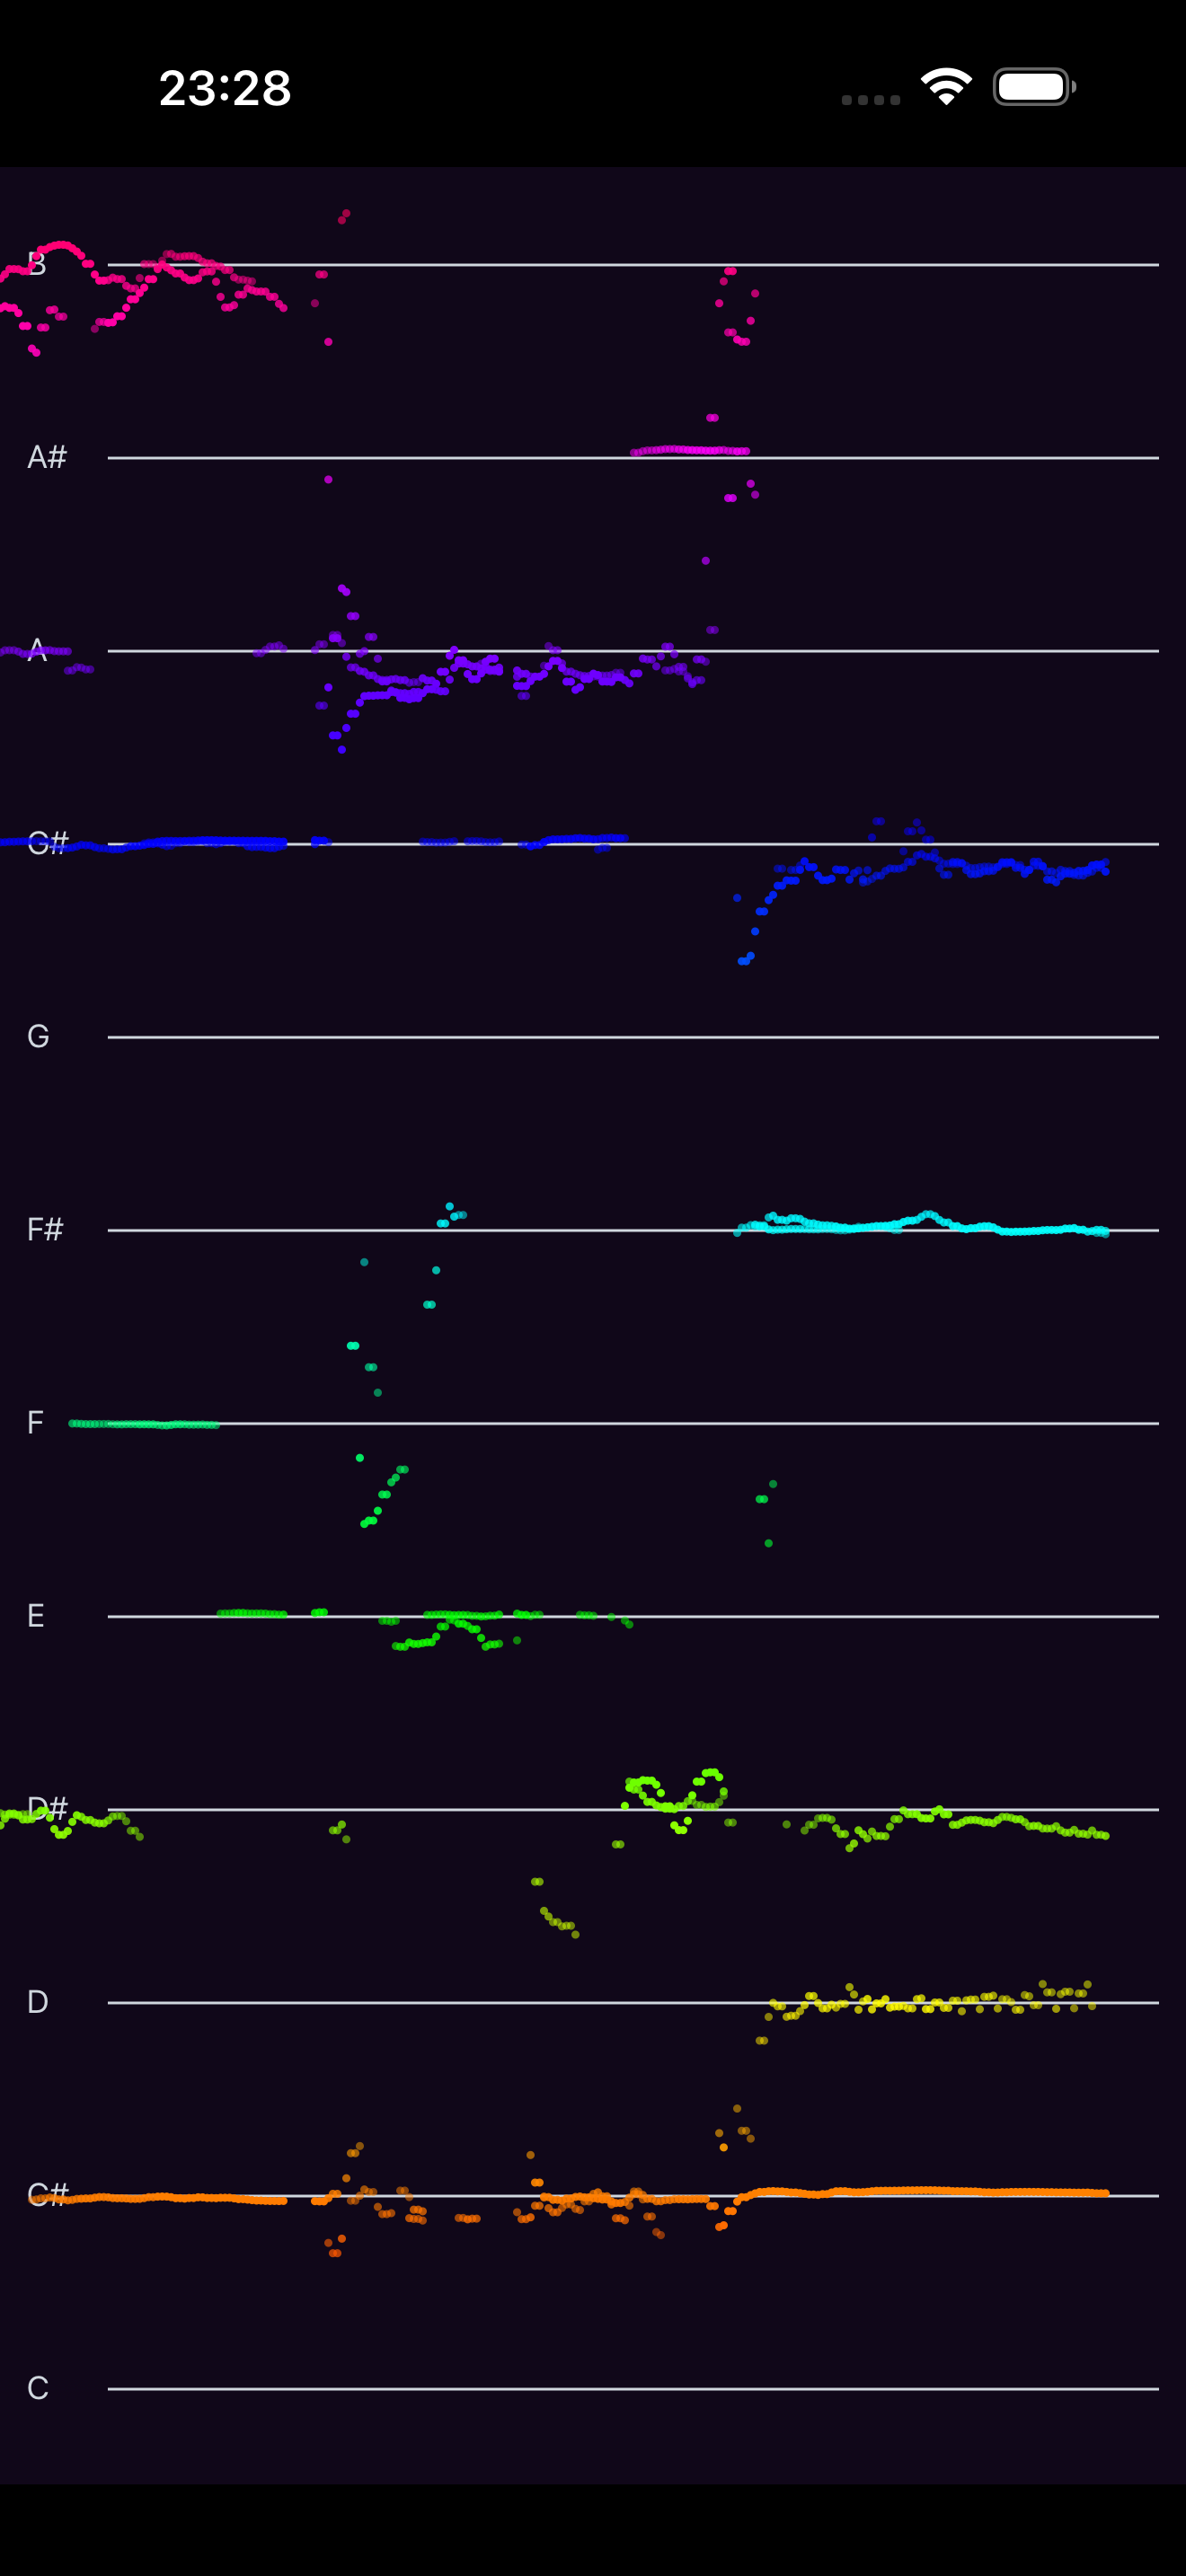
See multiple notes at once. Analyze chords and harmonies.
Tuner
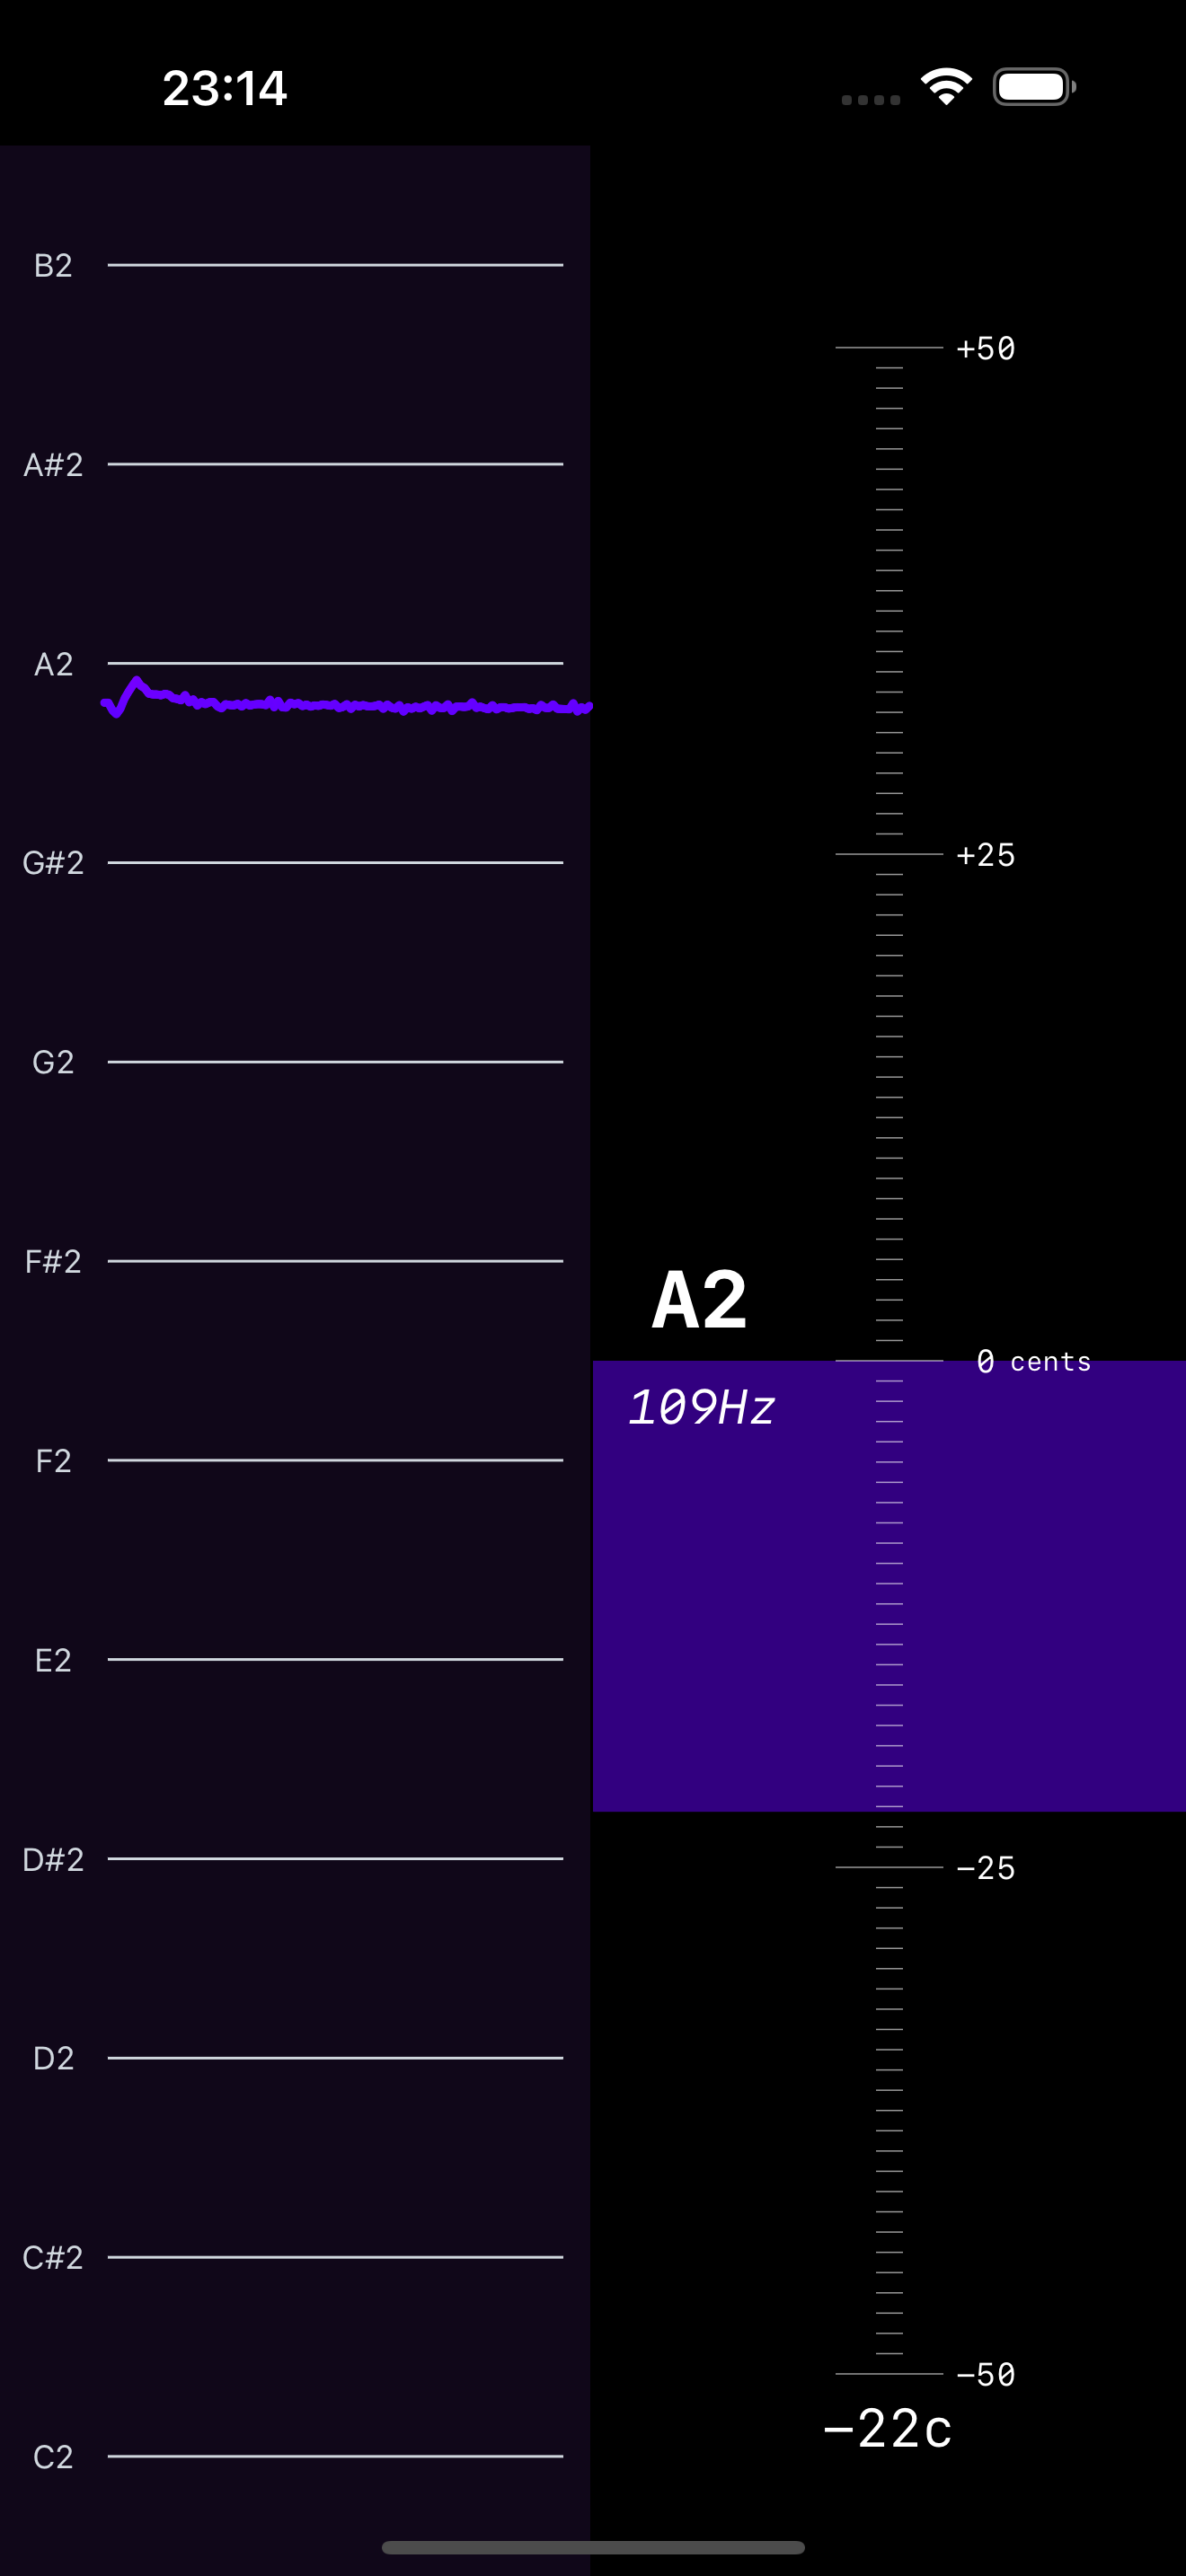
Cent-accurate chromatic tuner with spectrogram context.
Intonation Tracker
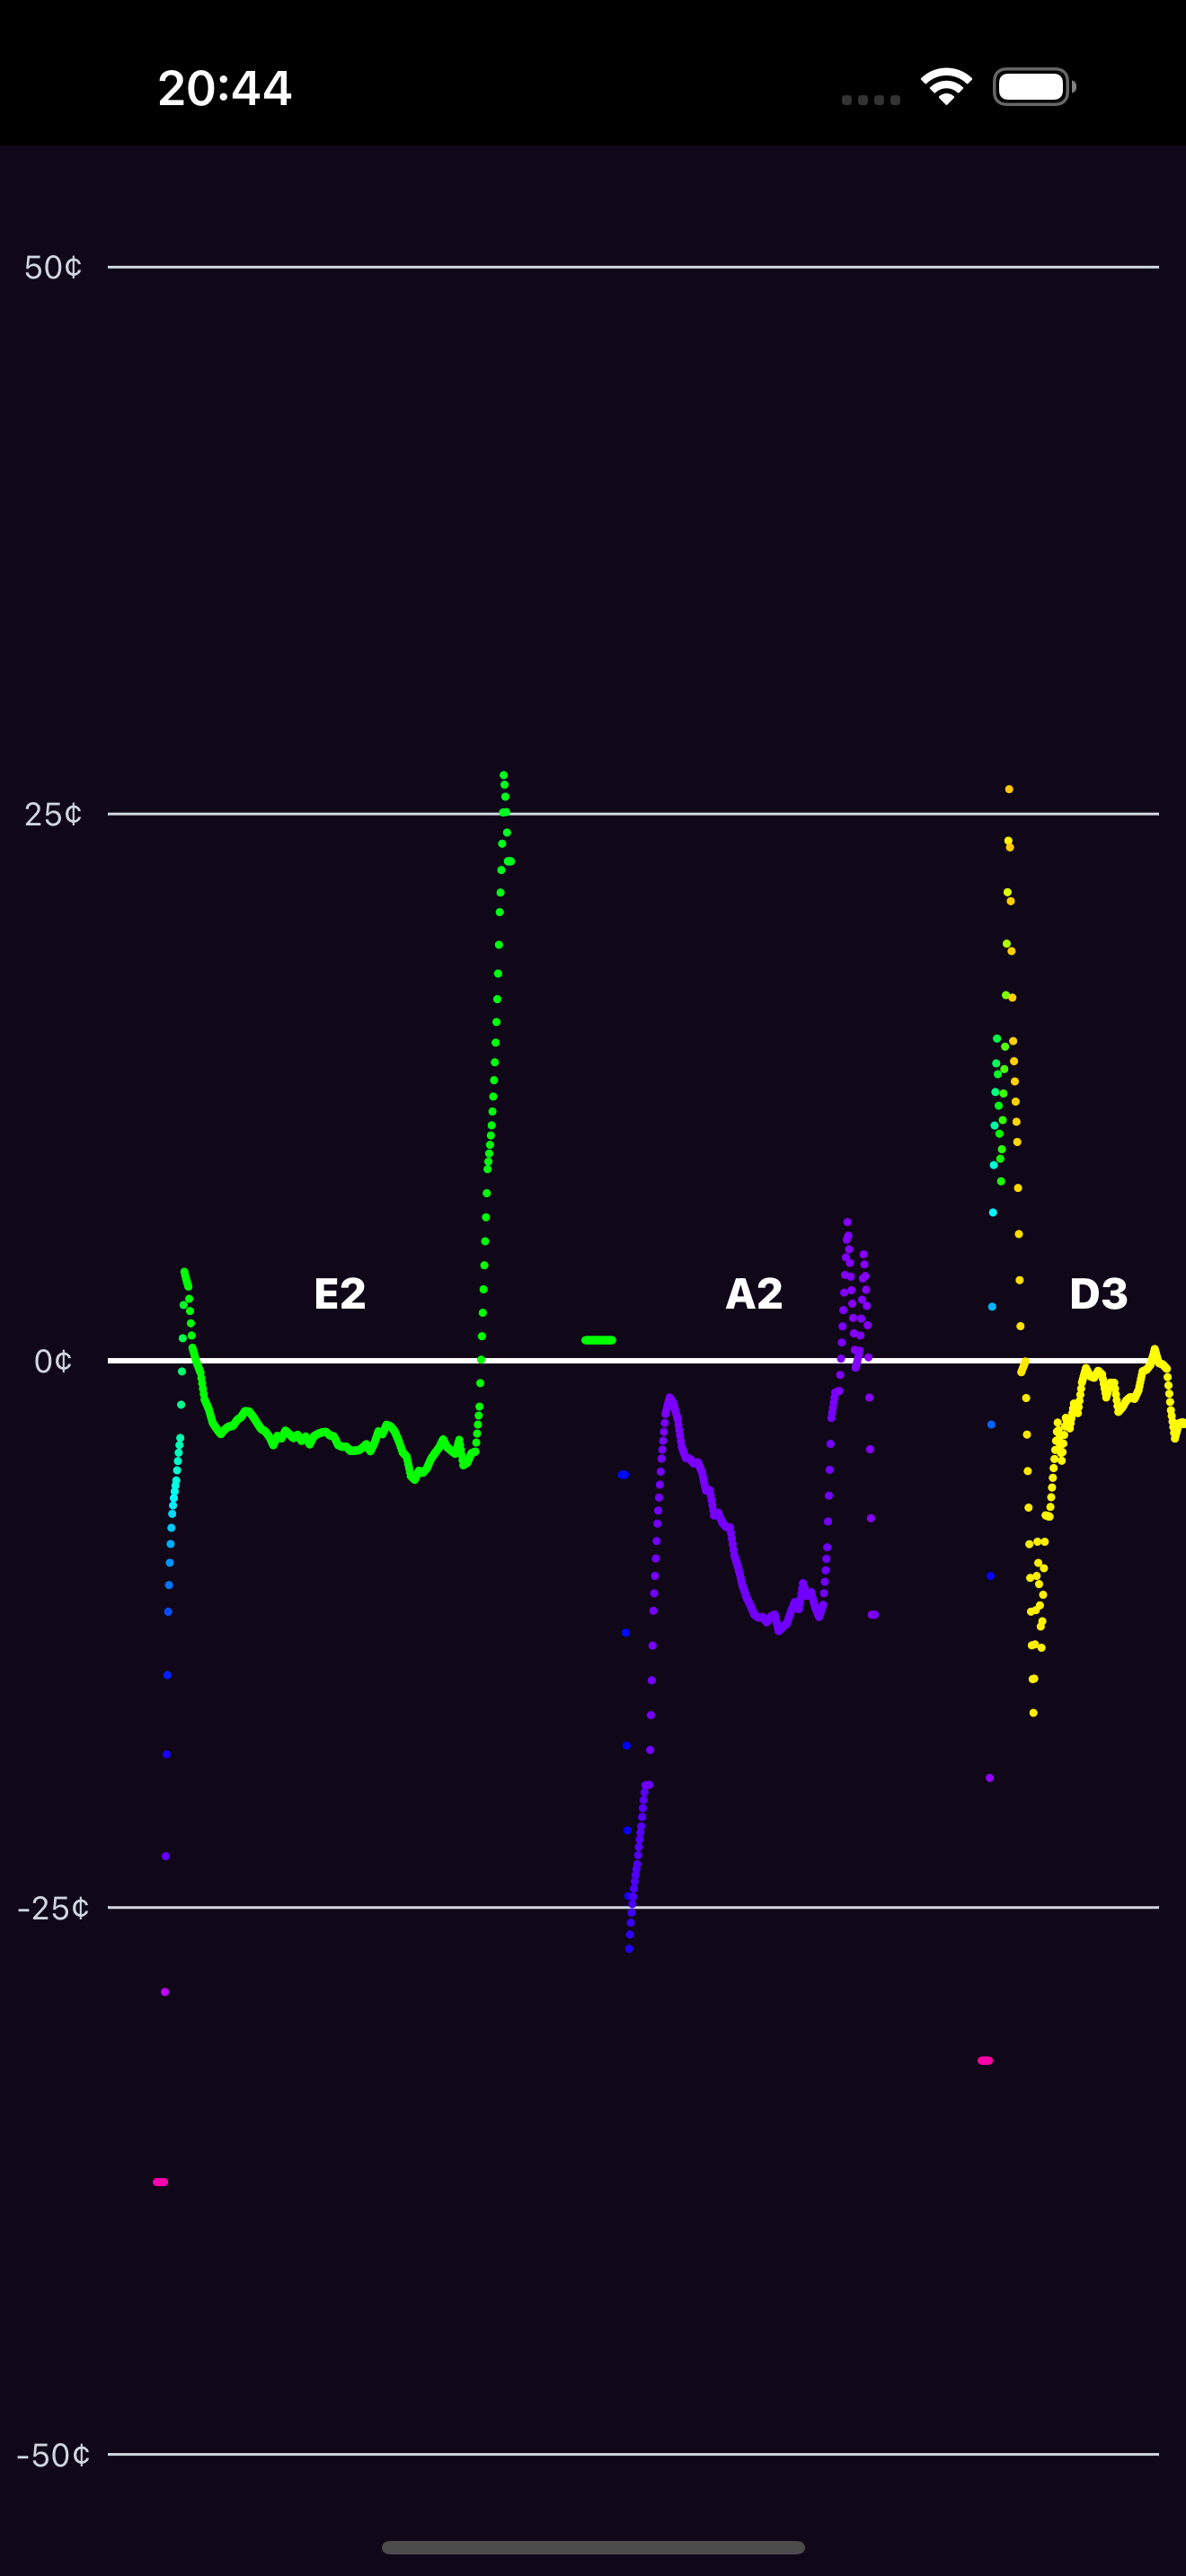
Track how close you are to each target note in cents.
Spectrum Analyzer
Log-frequency spectrum from 10 Hz to 20 kHz.
Sound
Tone Generator
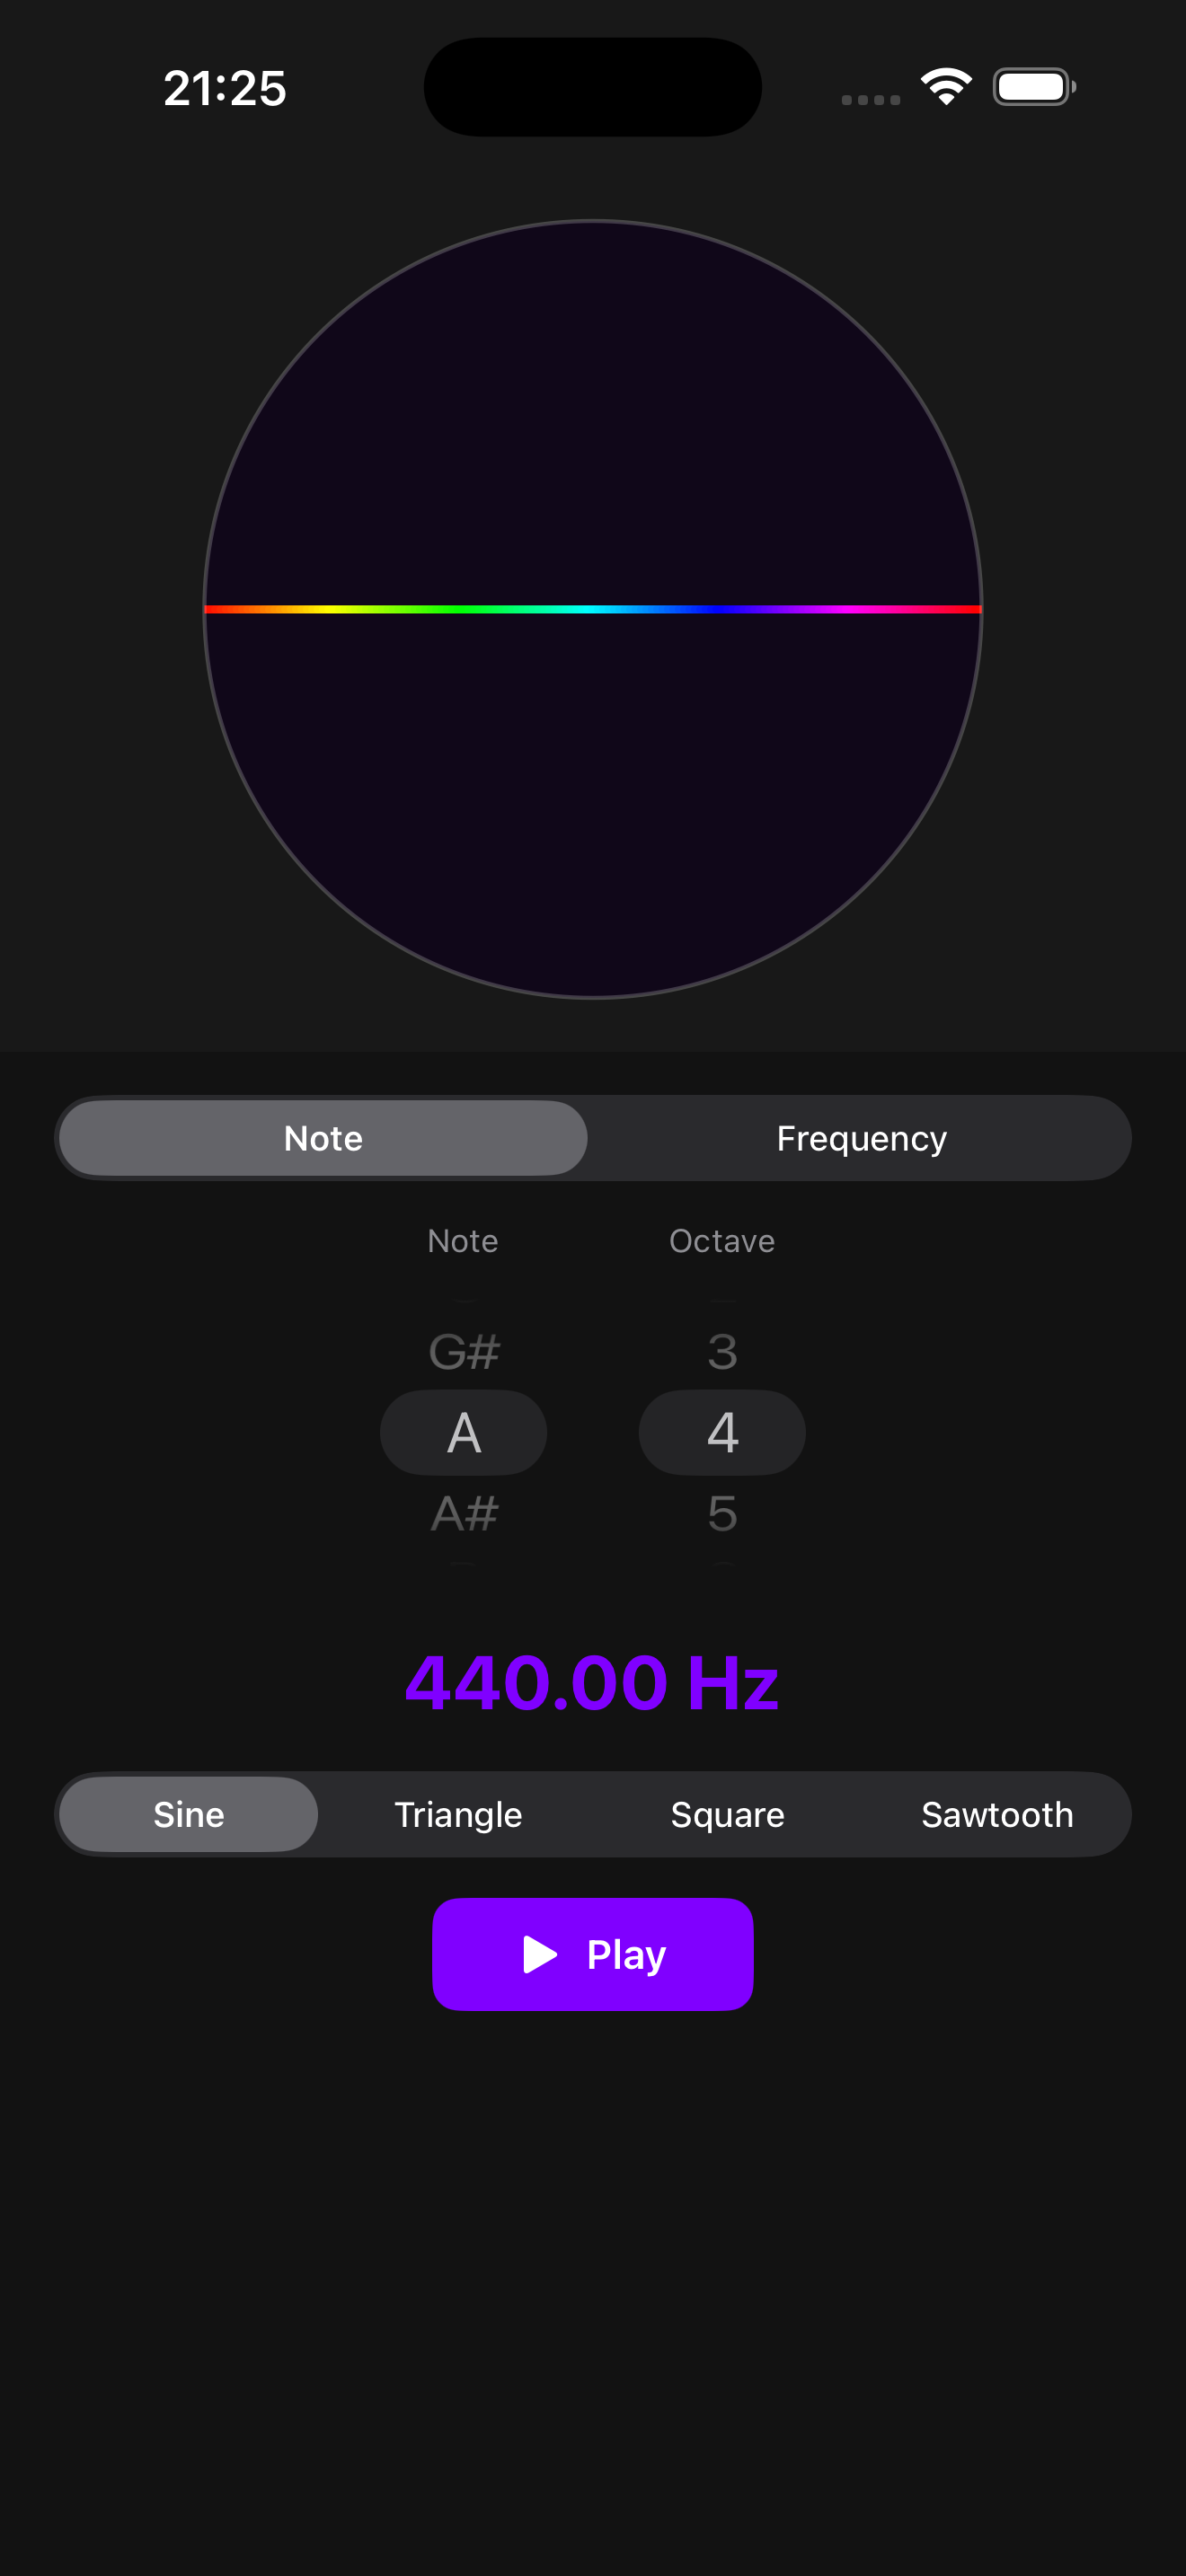
Generate reference tones by note name or frequency.
Metronome
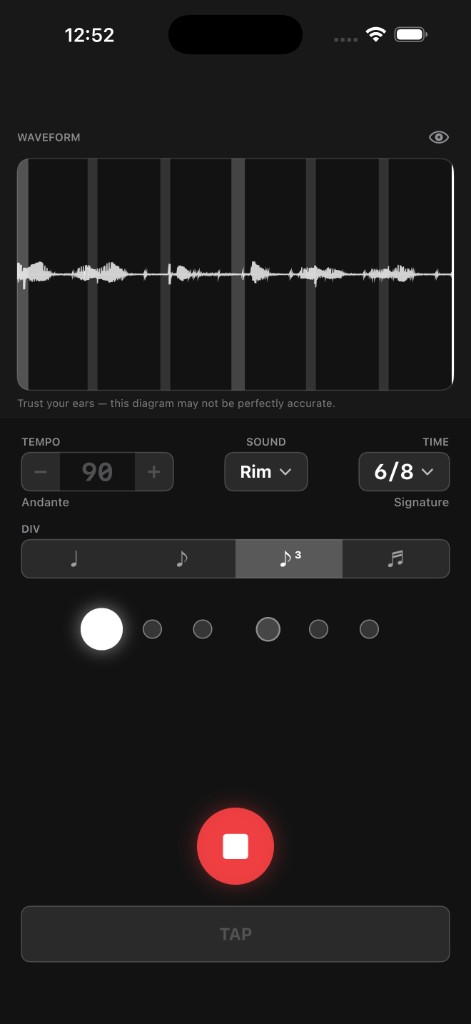
Practice rhythm with visual beat tracking and waveform feedback.
Keyboard
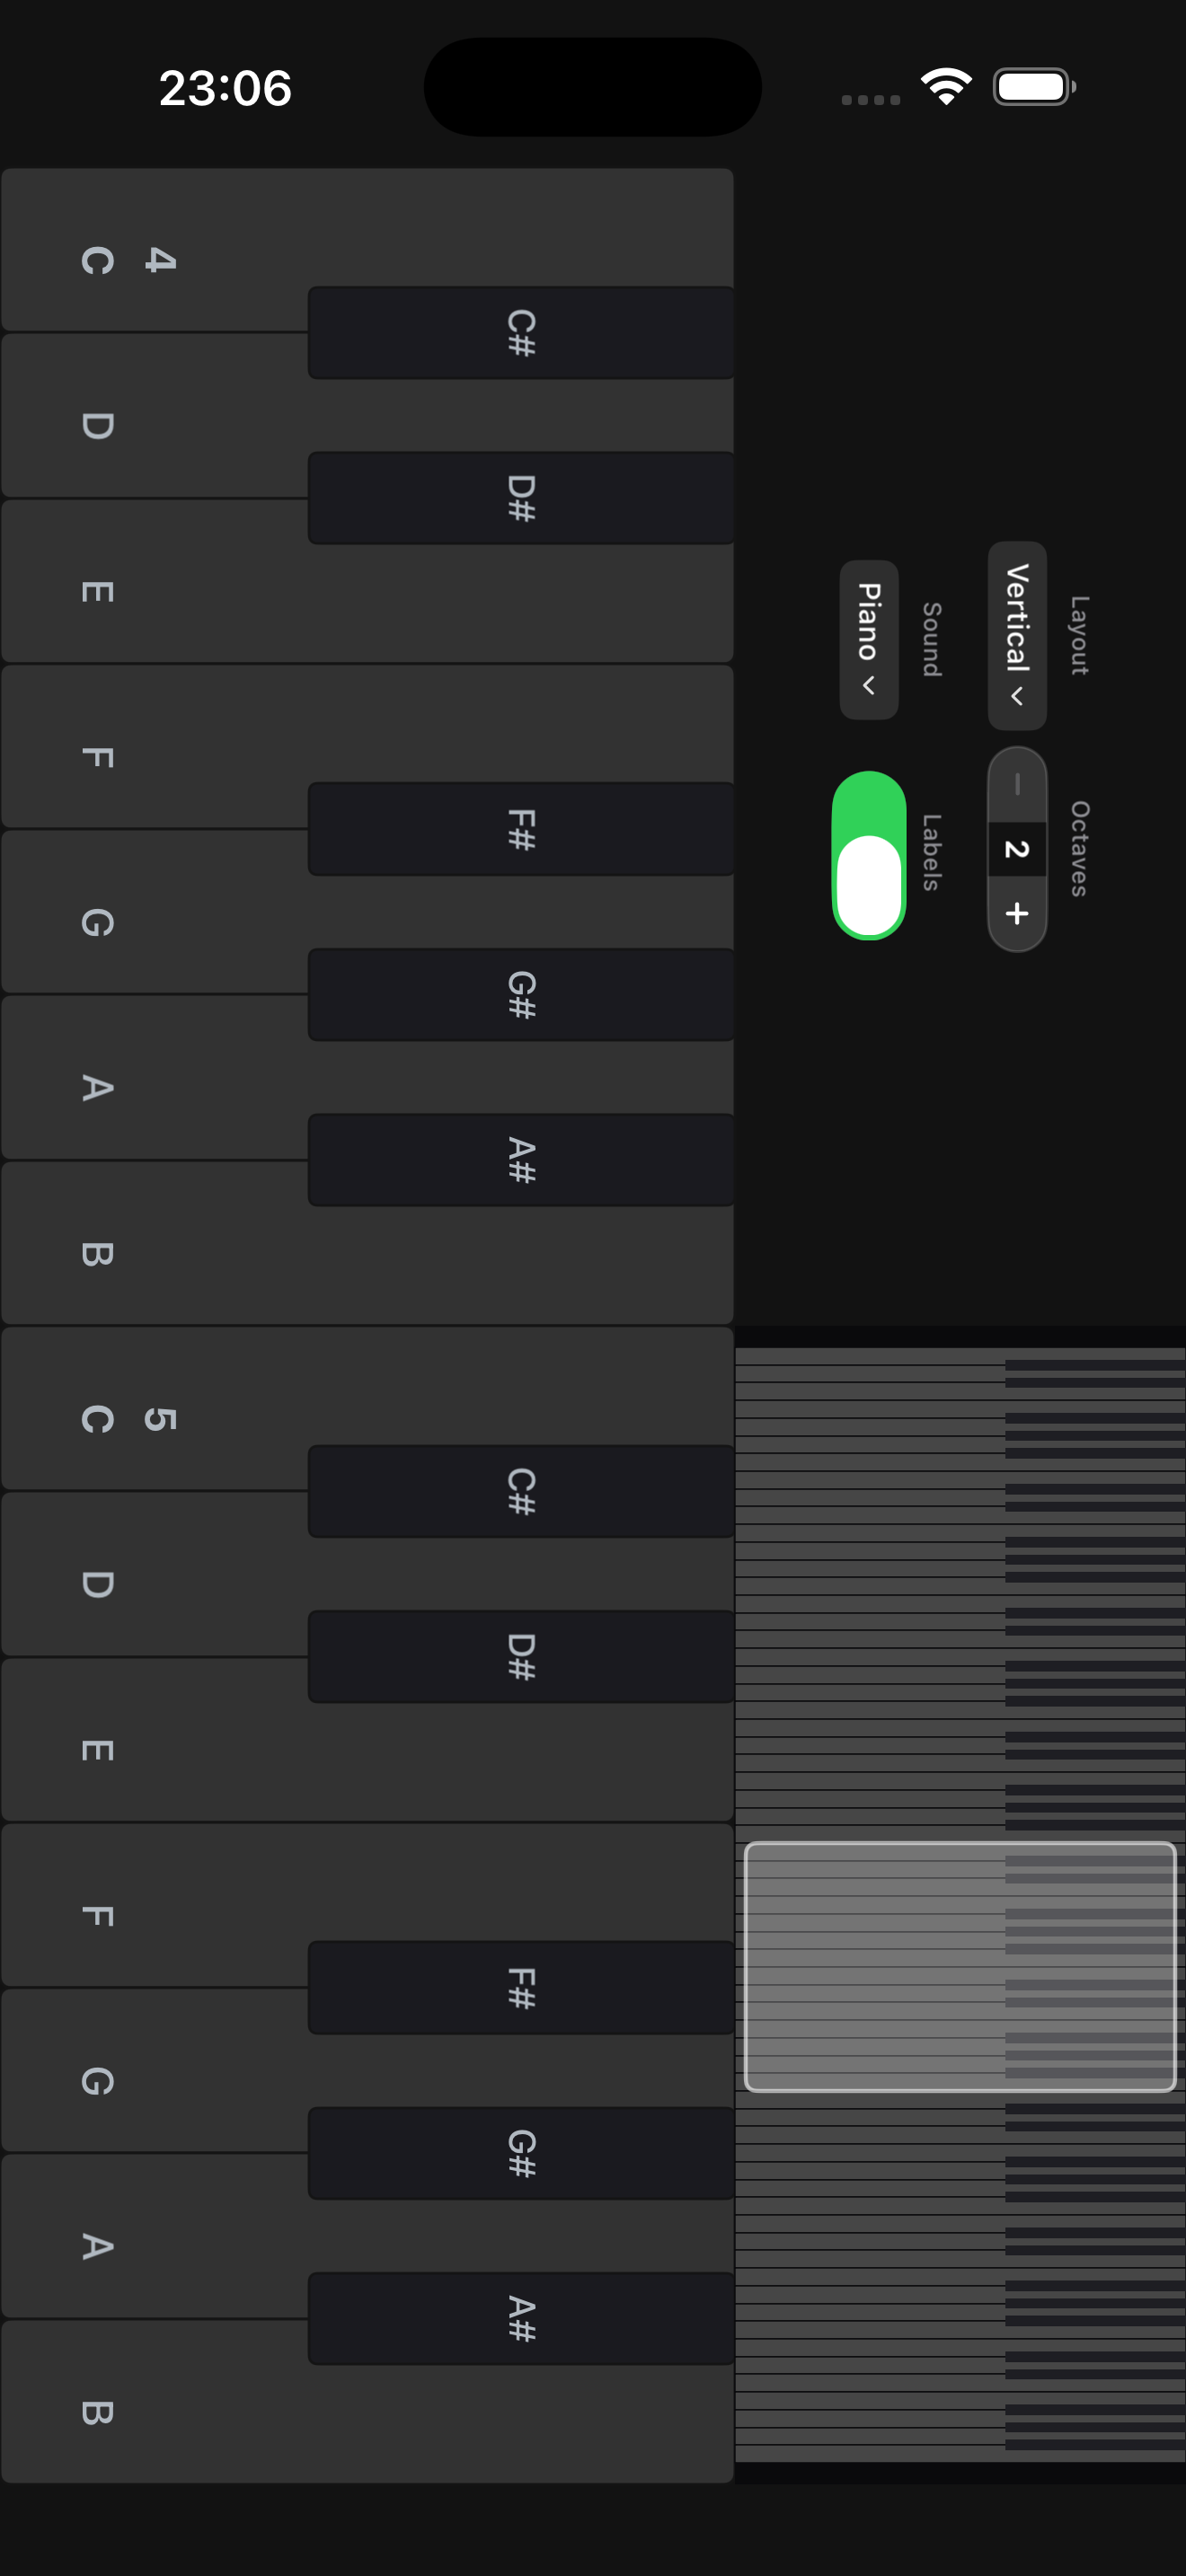
Sampled instruments, visual feedback, and quick octave controls.
Learn
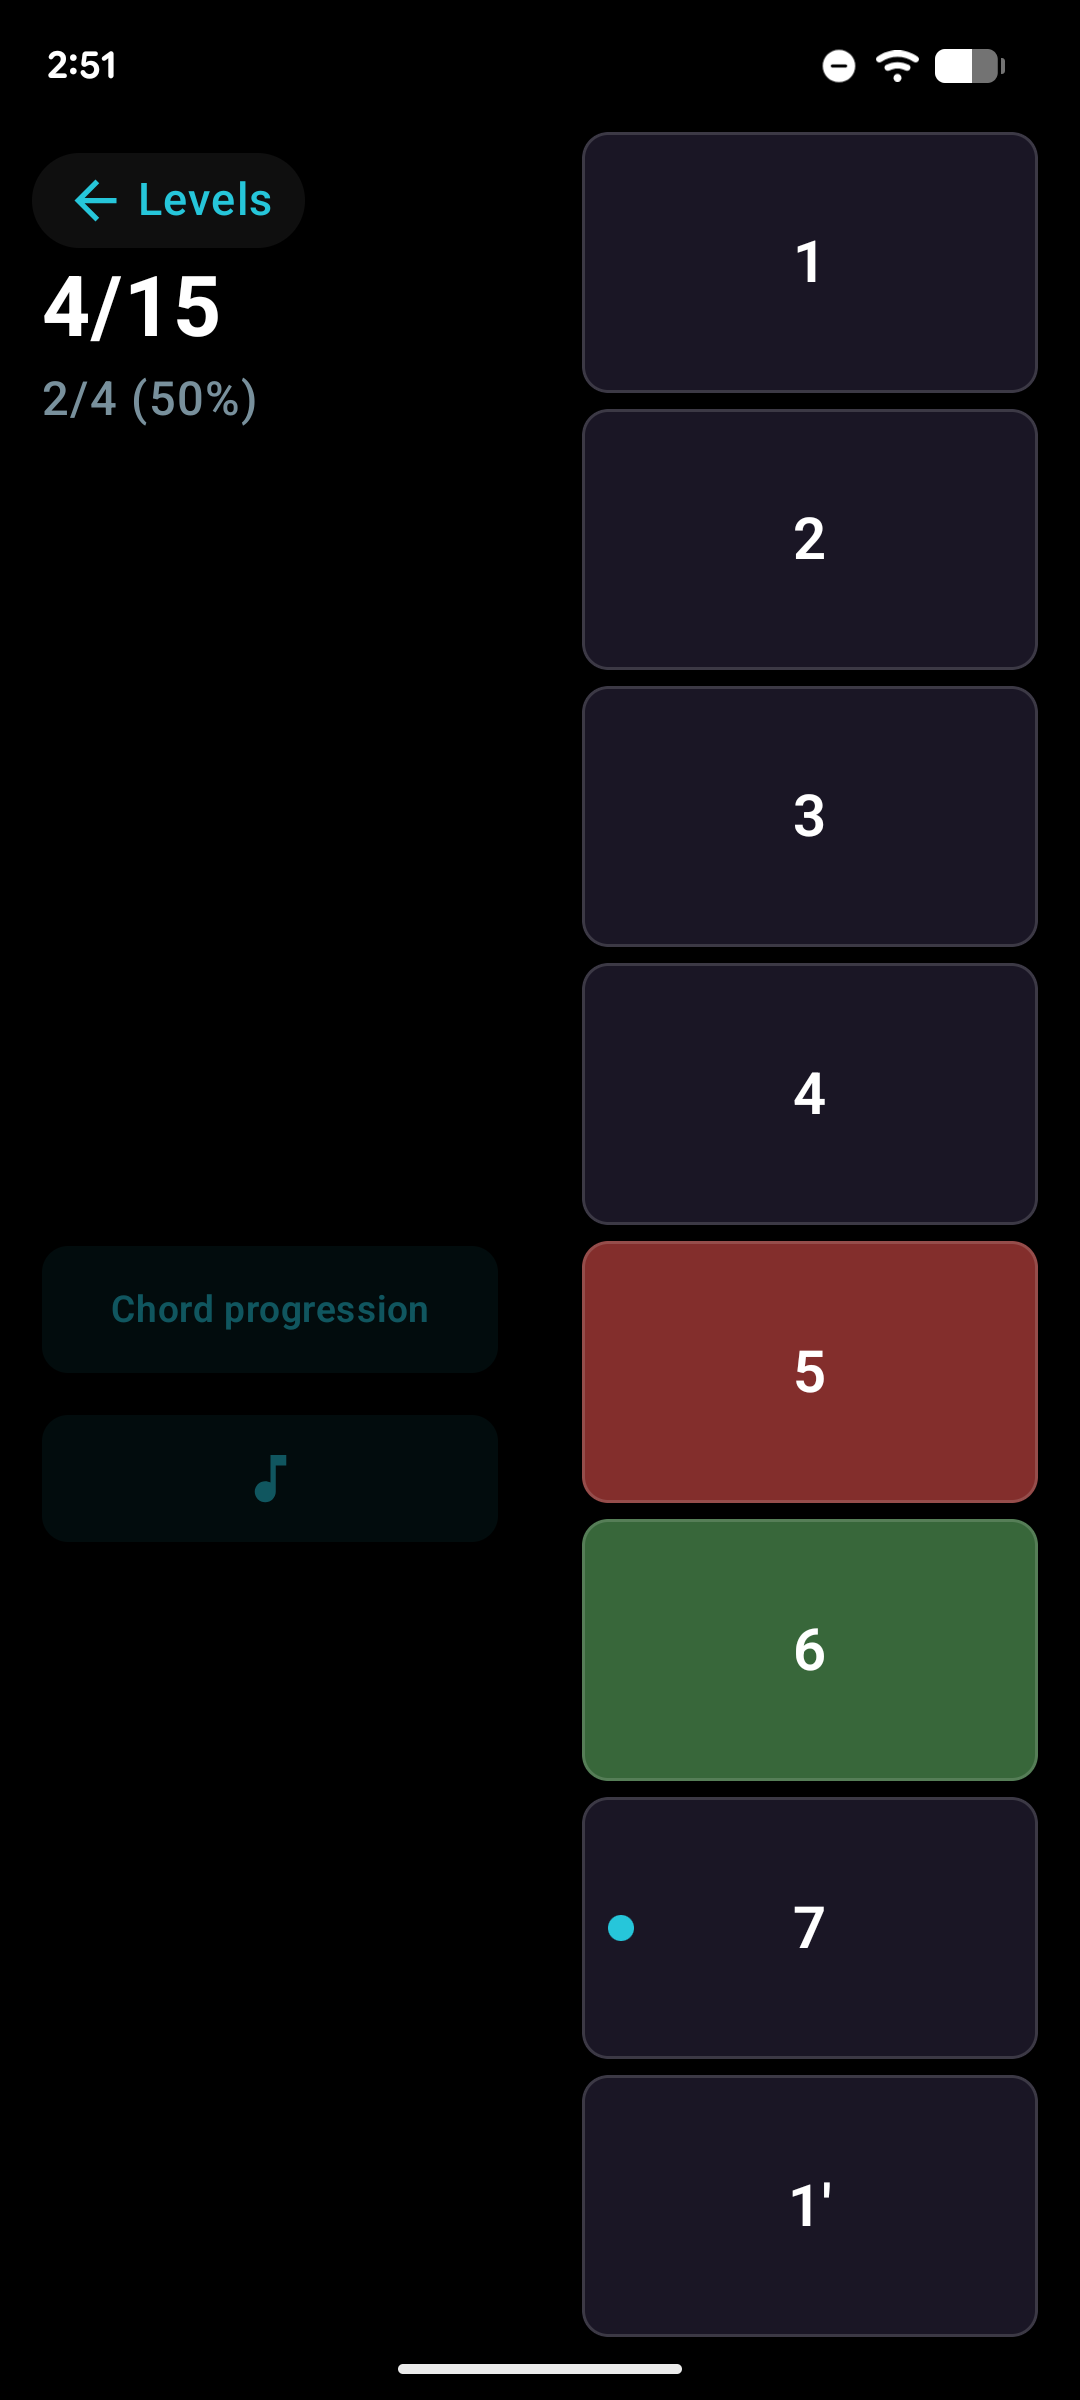
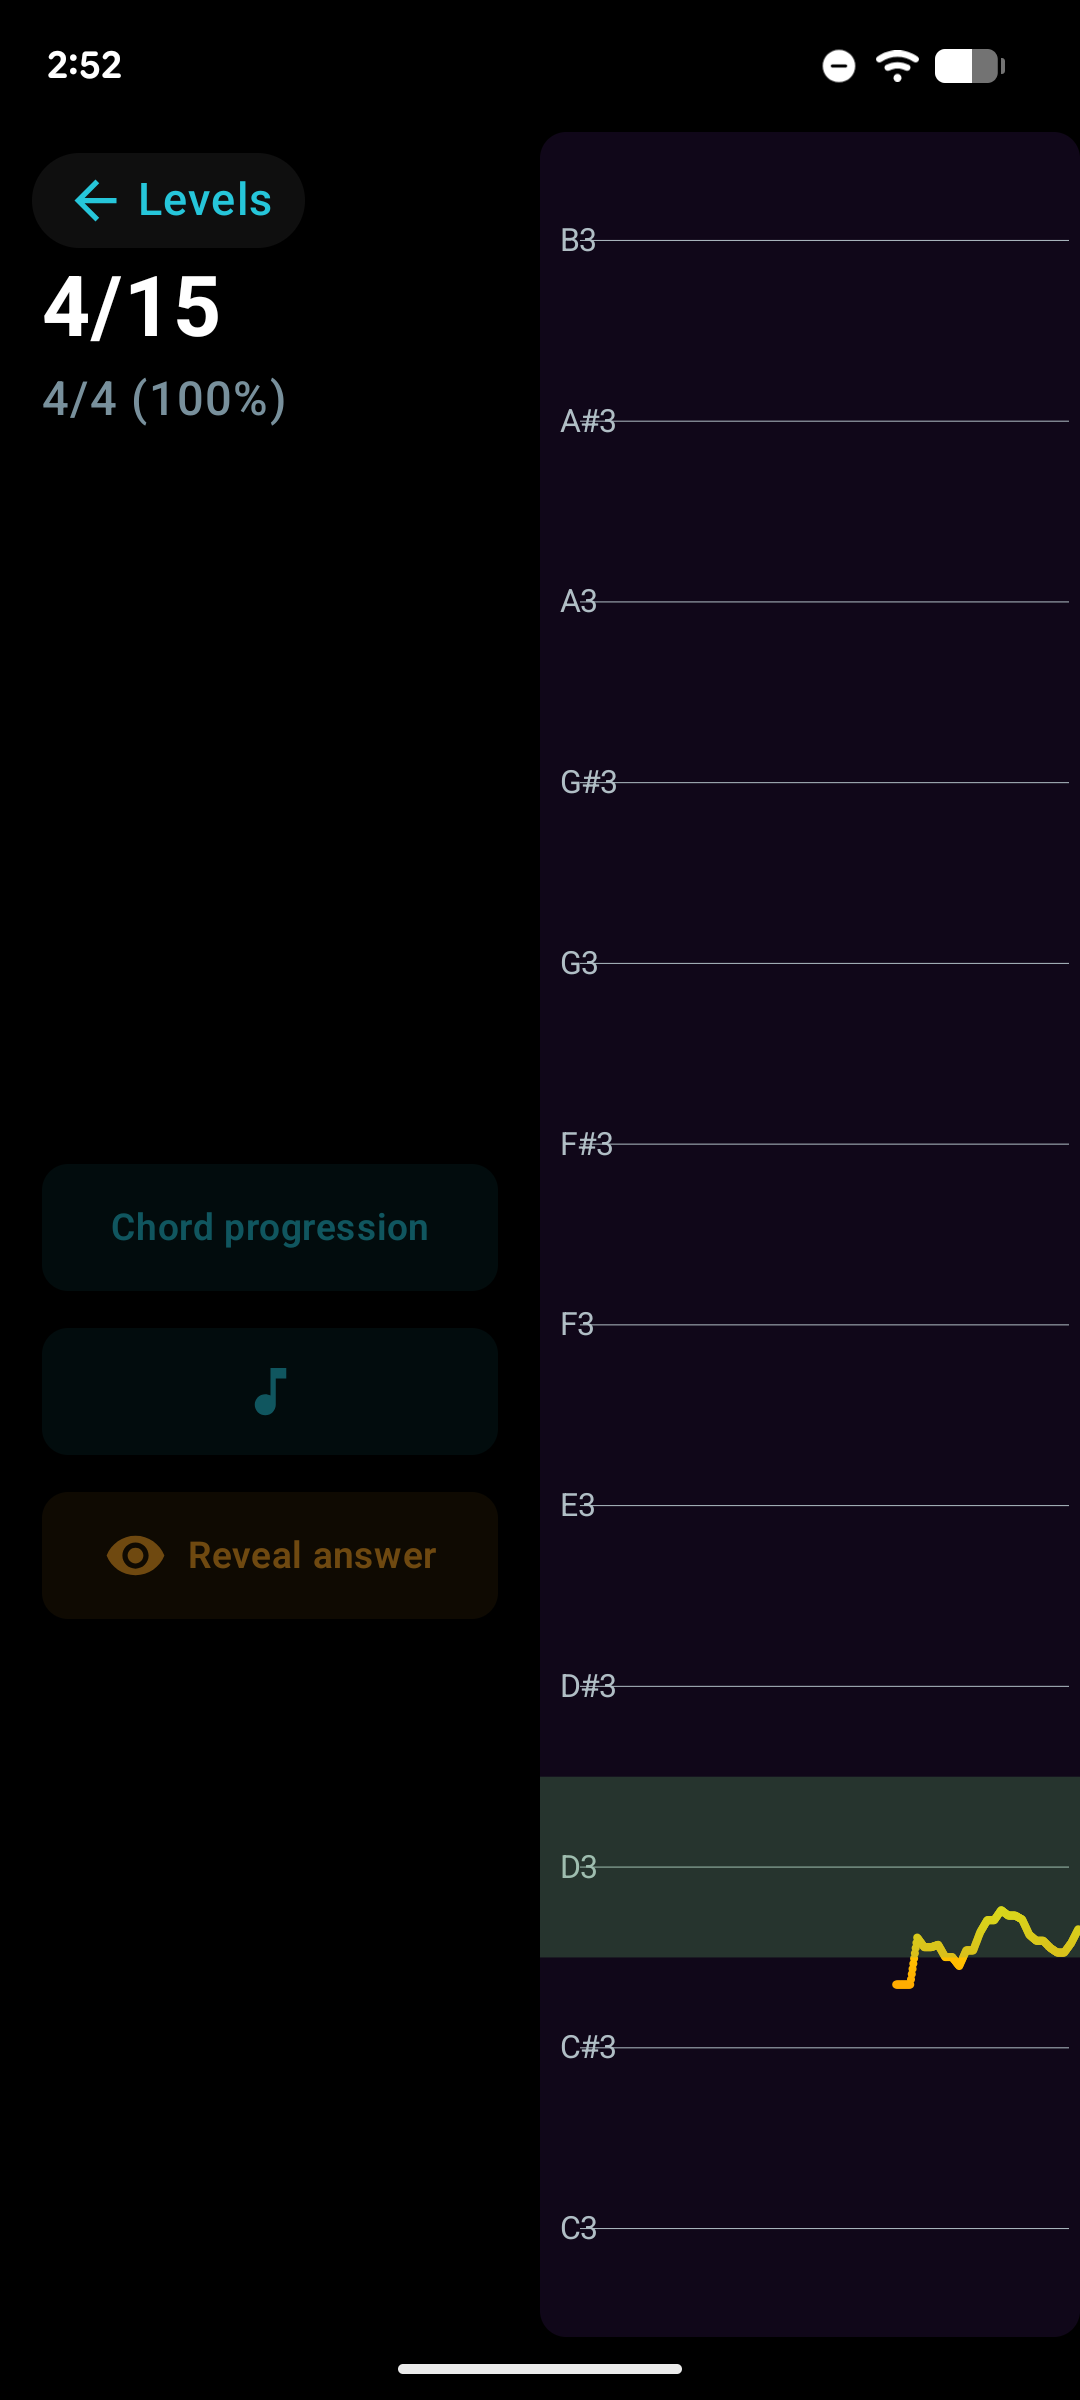
Relative Pitch Interval Training
Identify scale degrees by ear. Hear a cadence and tap the correct degree.
Solfege Trainer
Sing scale degrees in key. Build pitch memory through vocal practice.
Available on iOS and Android